/reboot/media/cb1ca522-65d6-11ef-8660-0242ac120010/37248e4a-4806-11ef-8bbb-0242ac120012/1-1-download.jpg)
Preference Mapping without sensory data is possible!
PREFERENCE MAPPING WITHOUT SENSORY DATA, IT’S POSSIBLE !
Preference mapping studies offer actionable insights for R&D teams by combining:
- the sensory objective characterization from the “experts” (to describe precisely and position the products on the sensory space),
- and the consumer preference modeling,
to understand what are the sensory expectations of the consumers and to identify precisely the ideal sensory profile to maximize consumer preferences.
But manufacturers may lack sensory data due to resource constraints (no internal panel, no budget for a sensory description of all products etc).
In this case, how can preference mapping be conducted solely based on consumer evaluation?
Our premise: consumers are also capable of describing products objectively and accurately
3 spontaneous words: simple and direct
Consumers only need to provide three spontaneous words per product. They quickly assess and automatically associate these key words with each product, focusing on what matters most. These words, chosen by consumers, precisely describe and differentiate the products without any prompting or bias.
Quantifying words with impact, beyond mere numbers
Our unique emotional weighting algorithm R3m Score measures the importance of impactful words and detects subtle signals. Developed over three years, it evaluates the language structure, including grammatical nature, logical relevance, valence, as well as the context, such as other associated words and product category. This algorithm assigns an emotional weight to each word, ensuring precise and meaningful insights beyond simple frequency counts.
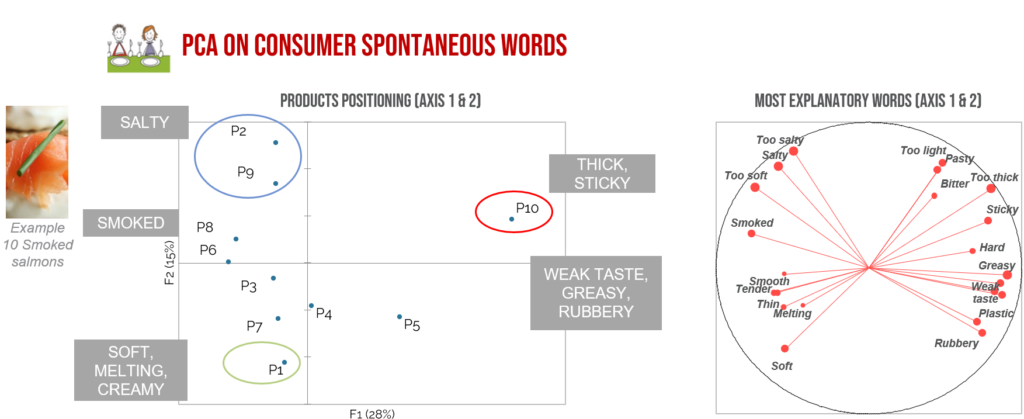
These scored consumer words can be used to conduct statistical quantitative analyses (e.g. PCA) in order to:
- Position the products according to their description
- Understand and describe their specific features, similarities and differences
In the example below, consumers’ descriptions of 10 smoked salmon products provide a good representation of the product universe. Salmons atr characterized and differentiated by consumers according to taste (salty, smoked) and texture (soft/melting vs. thick/hard), with 3 product groups identified.
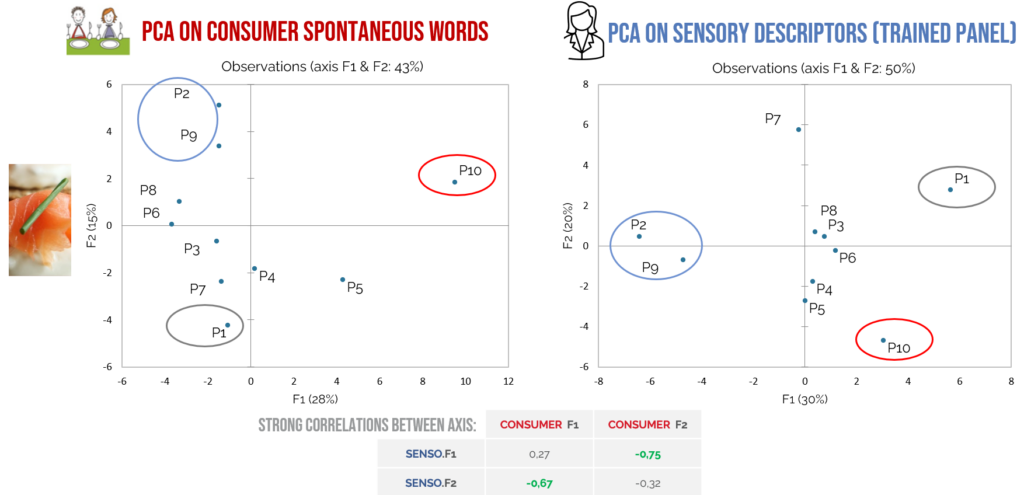
STRONG CORRELATION BETWEEN CONSUMERS’ AND EXPERTS’ DESCRIPTIONS
Several comparisons have been carried out on food category (plant-based beverages, beans, …), showing strong correlation and consistency between consumer description and sensory data provided by trained panels experts.
In the example below of smoked salmon, described on the one hand by consumers and on the other by the panel of sensory experts, we can see a very similar positioning of the 10 products in both cases, which clearly demonstrates the relevance of consumers in describing and differentiating products.
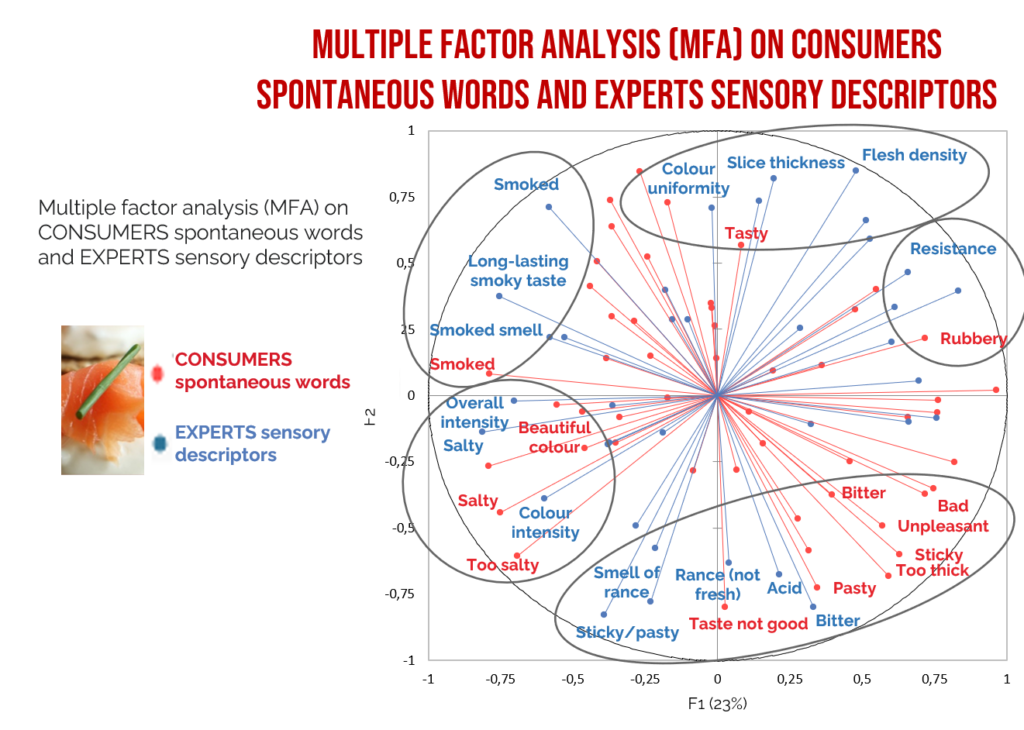
Similarly, a Multiple Factor Analysis (MFA), analyzing both types of data, highlights the proximity and similarity of the two descriptions, with similar and consistent axes.
SO CONSUMERS WORDS CAN BE USED TO MAP AND MODEL THE PREFERENCES
Although sensory description by experts remains the most operational approach for preference mapping (to define the objective and precise sensory profile to develop, to manage your product development over time…),
consumer language can be a good substitute to help R&D teams understand the products perception, position the products, and model consumers preferences without trained panel descriptors available.
Also, see our other recommendations for optimized Prefmap studies:
RECO#1: CAPITALIZE ON CONSUMER SPONTANEOUS FEELINGS TO GO BEYOND SIMPLE LIKING
RECO#2 : OPERATIONAL AND ACTIONABLE SEGMENTATION OF PREFERENCE
RECO#3 : BETTER UNDERSTAND AND TARGET YOUR PREFERENCE SEGMENTS
RECO#4: INTEGRATING LIKING INTO THE CONSTRUCTION OF THE SENSORY MAP
/reboot/media/cb1ca522-65d6-11ef-8660-0242ac120010/af69ca24-4610-11f0-be7c-ca83f24d1f3e/1-1-a-group-of-people-sitting-around-a-table-with-food-vjsj-hgoeg0.jpg)
/reboot/media/cb1ca522-65d6-11ef-8660-0242ac120010/782e348a-460d-11f0-a6b4-ca83f24d1f3e/1-1-two-sliced-lemons-on-surface-443wmczewem.jpg)
/reboot/media/cb1ca522-65d6-11ef-8660-0242ac120010/8c89db20-3d01-11ef-846b-0242ac120012/1-1-download.jpg)